

For the past twenty years Bluetooth has supported reasonably high-quality stereo audio. But many have found the standard codec – the coder/decoder system which reduces the amount of data enough for the sound to be transmitted – to be unsatisfying. So several alternative “optional” Bluetooth codecs have been developed over the years and incorporated into some equipment.
It is often thought and almost universally claimed that these other codecs sound better. The way to check that would be to set up properly conducted double-blind trials with a statistically valid sample of listeners. So far as I know, no-one has done that and I’m not about to either. Just the cost alone … shudder!
But what I can do is objectively measure some using decent real-world devices and check the traditional performance characteristics: frequency response, signal to noise ratio and the related dynamic range, harmonic and intermodulation distortion. I do that here for the SBC, AAC, aptX, aptX HD and LDAC codecs. These are the most common ones, and that is the “quality” order with which they’re generally regarded. (There are a couple of newer “high resolution” codecs around but not much equipment yet supports them.)
To understand these codecs better, I’d suggest checking out our article “Bluetooth codecs – getting music from your phone to your audio gear”.
Now, let’s get into the objective measurements. First, I think we need to understand how I made them otherwise they may be hard to interpret. However, I recognise that while I think that kind of stuff is fascinating, it’s quite possible that you might not. If so, then simply skip the next section and go straight to “The Measurements”.
Method, or should you believe these measurements?
In fact, many devices with plenty of available codecs really don’t give you any control over which they’ll use. Typically they default to the “best” – as is generally considered – of the codecs supported by both the transmitting and receiving device. Remember, all these codecs need compatible equipment at both ends to work.
So I needed gear that allowed control. Fortunately we sell a number of devices that provide precisely that. The first is the FiiO BTA30 Pro Bluetooth transceiver (review coming soon). This can be switched to either transmit or receive Bluetooth. If receiving, it has an LED that changes colour according to the codec that is being received. If transmitting, you can cycle through all the available codecs, the colour of the LED showing which one you’re using.
Initially I did some tests using this principally as a receiver, with an iPad transmitting AAC, a Samsung tablet transmitting aptX and a Huawei phone transmitting LDAC. But I was stuck. I wanted to compare these with the SBC codec. That is the original stereo audio codec supported by all Bluetooth audio devices. A big part of my interest was to see if any of the newer and improved codecs really were an improvement. I do have a couple of old Android phones around, but they also supported “better” codecs than SBC.
But then I remembered the magnificent Astell&Kern A&futura SE180 portable digital audio player (see also our Astell&Kern A&futura SE180 review). It supports – and allows the user to explicitly choose – SBC, AAC, aptX, aptX HD and LDAC. Furthermore, there are actually two LDAC settings: “LDAC – connection quality optimization” and “LDAC – audio quality optimization”.

Well, that solved one question upon which I’d occasionally pondered in recent years: what’s the difference in the Sony Headphone Connect app (which manages connections with its headphones) between the settings to prioritise connection reliability or to prioritise audio quality. I’d thought that perhaps the former would switch it to SBC mode, but it seems that LDAC (which is a Sony-developed codec) itself has two different bitrates available.
So I did my tests using the FiiO BTA30 Pro and the Astell&Kern SE180. And for the codecs where I had lesser devices – the iPad, tablet and phone – with compatible codecs, I also measured those with the FiiO. But there was one slightly worrying thing about the measurements: there was a slight droop in the bass. It was only around 0.6dB at 20 hertz, but these days I’m quite used to “ruler flat” frequency responses from modern digital audio equipment. Was this a characteristic of Bluetooth? Or of the FiiO BTA30 Pro?
Fortunately, I also had to hand the superb Topping D90SE DAC (see also our Topping D90SE review), which also includes a Bluetooth receiver. And that receiver is compatible with, at least, SBC, AAC, aptX, aptX HD and LDAC. So I repeated the measurements. The results were fairly consistent … minus the bass droop. I’ve included all the measurements, since we’re looking to see what differences there are with real world equipment, and it turns out that there were some interestingly variations between devices.
There’s a lesson here in testing gear: what precisely are you testing? For example, after my initial measurements, one of the things I absolutely had to confirm was the frequency response of LDAC. I’d used my Huawei phone and the FiiO Bluetooth receiver, and there was this significant hump in the bass, centred on around 40 hertz. It was up around five decibels.

But with the Astell&Kern SE180 and the FiiO BTA30 Pro the bass was, well, not ruler flat but with that slight droop at the end. And with the A&K and the Topping D90SE, the bass really was ruler flat. So it turns out my phone was boosting the bass in there somewhere.
All of which is to say, I did a lot of checking and cross checking and double checking and reverse checking, so I’m pretty confident in these measurements. I hope that you’re satisfied with them too.
SBC – the original standard
SBC is included in every device capable of supporting stereo audio. In many headphones – including some highly reputable brands – it remains the sole music codec provided. Might this suggest that perhaps it isn’t quite as poor as has often been suggested?
Let’s look at frequency responses first. Now in each of these sections I’m going to isolate the particular codec’s performance, but later we’re going to mash them all together to provide a more intuitive feel about how they compare.
So, here’s the frequency response using the SBC codec, with the test signal delivered by the Astell&Kern SE180 to the FiiO and Topping receivers, and with a 16-bit, 44.1kHz (ie. CD-standard) signal:
Apart from the aforementioned (and hereinafter ignored) bass droop in the FiiO, the results are very nearly identical. The response is almost dead flat up to 15kHz, at which point there’s a roll-off so that both are down around one decibel at 17kHz and hit 20kHz at between -4dB and -5dB. In theory, some young people with top notch hearing may be able to detect that.
More or less for completeness, here’s the frequency response with a 24-bit, 96kHz test:

Down the bass end, not much difference. But at the top end, the roll-offs are coming in at around 14kHz, and are closer to brick wall. The -3dB point is at 15.6kHz.
If you’re using gear restricted to SBC, it might be best to stick with the standard resolution content.
But there’s more to life – and the performance of codecs – than frequency response. So let’s check out noise and distortion with SBC. With 16-bit signals, noise with SBC was -96.7dBA or -97.5dBA, not noticeably different from a wired 16-bit performance. Total harmonic distortion was 0.017% with both receivers, and IMD plus noise was 0.026% with the FiiO and somewhat more at 0.061% with the Topping (tsk, tsk!). Again, further down I’ll line these figures up against those from the other codecs, and you may find the results surprising.
With a 24-bit, 96kHz test, the noise with SBC was a quite astonishingly low -118.1dB (FiiO) and -121.7dB (Topping). THD remained at 0.017% for both, and now IMD+Noise was 0.025% for both. All those were figures over which high fidelity numbers nerds would have drooled a few decades ago.
But in both cases, the “Dynamic Range” was rather less impressive than the noise level. Not to the point of audibility, but still the numbers didn’t look as good: 101.5dBA for the FiiO, 109.2dBA for the Topping.
Here’s what this looked like.

The noise profile with the two different receivers, and the same transmitter, is quite different. The 1kHz spike is the test signal. The Topping seems to have more noise close in frequency to the test frequency, but less in the higher frequencies. That said, in neither case should that noise be audible, and certainly not intrusive, although it may help mask low level detail.
AAC – of importance to those with Apple devices
Your iPhone or iPad will use the AAC codec for Bluetooth-carried music, so long as your headphones or whatever supports it. Otherwise it will “drop back” to SBC. Certainly if you use AirPods with your iOS device, you’ll be using AAC. So AAC is an extremely important and widely used codec.
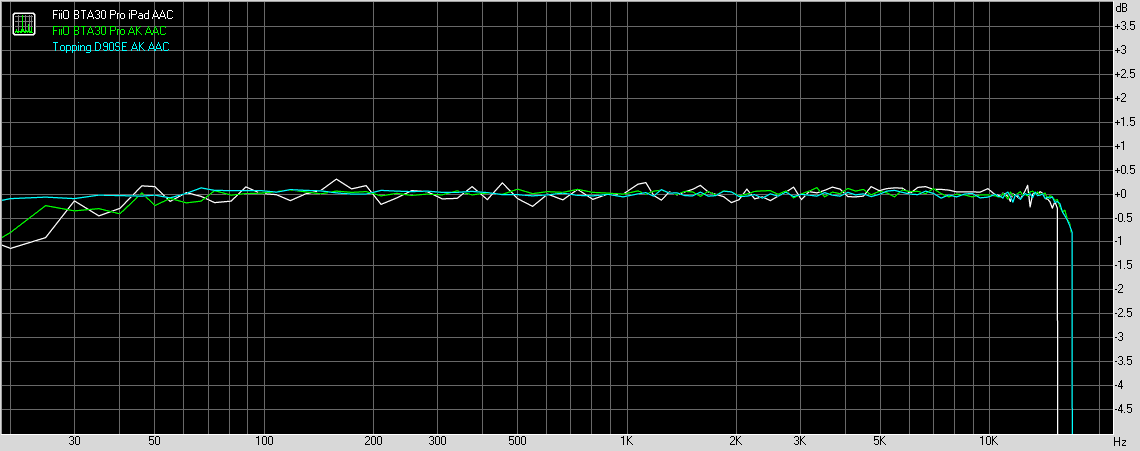
Here’s the frequency response with CD-standard signals:

As you can see, I used the SE180 digital audio player with both receivers, and an iPad with the FiiO receiver. The responses with the SE180 are virtually identical except for the FiiO bass droop. The iPad response seems a little more jagged – but we are talking about less than ±0.2dB, so it’s a curiosity rather than significant. But also, while the A&K-sent signals extend out to 16.9kHz, the iPad-sent one cuts off at 15.3kHz. I can only assume that the iPad is responsible for that. I expect it would be the same for an iPhone since they both use iOS.
With 24-bit, 96kHz signals, there was less variation in the frequency response, but again with the Astell&Kern player sending the signal, the high end extension was slightly less than with 44.1kHz sampling. The “shoulder” was around 14kHz and none of the responses reached 16kHz at the -3dB point. Here’s the graph:

With 16-bit signals, noise with AAC was -96.9dB A-weighted for the iPad/FiiO, -97.0 for the A&K/FiiO and -97.6 for the A&K/Topping. But dynamic range was somewhat poorer: 92.8dBA with the iPad/FiiO, 91.0dBA with the SE180/FiiO and 90.6dBA with the SE180/Topping. I’ll show the 24-bit graph shortly so you can see what’s going on. THD was generally better than for SBC: respectively 0.016%, 0.00104% and 0.00090%. Impressive. But IMD+Noise was consistently worse than with SBC. With iPad/FiiO it was 0.129%, with SE180/FiiO it was up to 0.236% and with the Topping it was 0.278%.
The 24-bit noise levels were really quite varied. With the iPhone, the level was -106dB A-weighted, -118d.3dBA for the A&K/FiiO and an impressive -120.9dB for the A&K/Topping. Here’s a graph showing the noise:

It seems that at least with the iPad version of AAC, the encoding generates quite a bit of noise around the test frequency. And since that test frequency is smack bang in the middle of the audible bandwidth, the A-weighted result is a relatively poor number. I strongly suspect that this is at least in part an artefact of using a test signal. It is likely not at all obvious with actual music content, what with their mix of frequencies across a wide bandwidth. Still, it is a kind of interesting result.
The dynamic range numbers are more like 16-bit results. But this time the iPad/FiiO combo was the best at 99.4dBA, while the SE180/FiiO was 91.6dBA and the SE180/Topping was 91.3dBA. Here’s the graph for that.

Note that all three have that apron around the test frequency, although it’s most pronounced with the iPad source.
Still with 24 bits and 96kHz, THD was much the same has it had been with 16-bit signals, in the same order: 0.015%, 0.00104% and 0.00091%. But IMD+Noise with 24-bit signals was 0.040% for iPad/FiiO, 0.255% for SE180/FiiO and 0.229% for SE180/Topping. In other words, the iPad apparently produced only one sixth of the amount of IMD+Noise with the AAC codec as the Astell&Kern SE180. This suggests that the AAC encoder implementation must be somewhat different between the two devices.
aptX, the improved codec for Android
When improved codecs became a “thing”, the first to appear on premium Android phones was aptX. But was it really any better than SBC? For this I used a Samsung Galaxy TAB A, which goes aptX if it’s available, as well as the Astell&Kern SE180, on which I set aptX manually. So, 16-bit, 44.1kHz frequency response:

I don’t know if this is to become a theme, but again we have the regular everyday transmitting device – the Samsung TAB A in this case, resulting in less high frequency extension than when we use the Astell&Kern SE180 as the source. With the TAB, the output started its downturn at 15.5kHz. With the A&K the output was more or less flat to 17kHz. Still all managed to reach 20kHz at around -4dB for the TAB source and -2-and-a-bit decibels for the others. This alone certainly seems to be an improvement over SBC.
With 24-bit, 96kHz test signals, the outputs were even more closely bunched, with them turning over into descent mode around 15.5kHz. The TAB-sourced one hit 20kHz at -5dB, the other two at -3dB. Thus:

So, once again, steer clear of high resolution content sources if you’re limited to using the aptX codec.
Now, what about other measurements?
Well, with the 16-bit, 44.1kHz test signal, aptX delivered a signal to noise ratio of -97.9dBA for the TAB with the FiiO receiver, -97.0dBA for the SE180 with the FiiO receiver and -97.2dBA for the SE180 with the Topping receiver. Dynamic range was similar, at 95.9dBA or better for all three. Total harmonic distortion gratifyingly features two zeros after the decimal point for all three connections. In the same order they were 0.00504%, 0.00368% and 0.00402%. All three of which approximate to zero, which is about what you’ll hear.
But, again, intermodulation distortion plus noise was relatively high at, again in the same order, 0.276%, 0.194% and 0.199%. Don’t bother too much between the relatively subtle differences between these three figures, but think of them compared to the 0.061% (at worst) of SBC.
Audibly worse? Not to me, but others may differ.
Things were somewhat similar with 24 bits in play. The (same order) noise levels were -118.8dBA, -118.4dBA and -121.5dBA. (The Topping D90SE is particularly fine in the noise department!) Here’s the graph (and see how there’s absolutely zero mains frequency breakthrough for the Topping):

The A-weighted dynamic range falls short of those lovely noise level figures, at 100.1dBA, 99.6dBA and 103.8dBA for our three tests in order. Here’s what that looks like in graphical form:

Once again, we see the skirt around the 1kHz test tone. This is higher, and virtually the same, for the TAB with the FiiO receiver (white trace) and the Astell&Kern SE180 with the Topping receiver (cyan trace).
The THD with this test again contained those gratifying zeros: 0.00651%, 0.00588% and 0.00553%. But IMD+Noise was 0.276%, 0.194% and 0.190%, which aren’t reputable figures.
And so we move onto the next codec:
aptX HD … is it really HD?
Well, the answer to that question is another question: what do you mean by HD? Let’s start by seeing if the frequency response results with 16-bit, 44.1kHz signals are better than they’ve been thus far. Here’s what that looks like (with Astell&Kern only as the transmitter):

In one sense, the results are just about the same as for regular aptX in terms of extension – dead flat to 16kHz, then a roll-off to be -2dB at 20kHz. But they also have a quite different character. With aptX the trace in the high frequencies is quite jagged, but with aptX HD it’s quite smooth. I doubt that you can hear this difference directly, but it does suggest that perhaps the codec isn’t having to work quite as hard at stuffing in the sound into a limited space.
Now, let’s check out high resolution audio. Right away it was clear that there wasn’t going to be a wide high frequency response because when I fed the SE180 with a 24-bit, 96kHz test signal via aptX HD, the Topping D90SE reported a sample rate of 48kHz. So, this is what the frequency response looked like:

Which is to say, virtually the same as for the 44.1kHz test. Again, it eliminates the jaggies up in the high frequency section that were apparent for aptX.
Noise with 16-bit signals was impressive: -97.5dBA with the FiiO BTA30 Pro and -98.4dBA with the Topping D90SE. The respective dynamic range figures were 97.0dBA and 97.8dBA. THD? Both very low at 0.00112% and 0.00097%. But it’s with IMD that we see a marked improvement. Instead of being in the 0.2% range of AAC and aptX, they came in at 0.041% and 0.070%.
With the 24-bit test, noise was at -118.4dBA for the FiiO and -121.3dB for the Topping. Here’s the graph:

The white bumps at the left are a little mains breakthrough for the FiiO. I have no idea what the Topping is doing with those green spikes to the right, but you’re not going to hear them since they peak at -130dB at most.
The dynamic range figures are not as good: 102.4dB for FiiO and 116.5dB for Topping:

I really don’t quite know what to make of this. The Topping is orderly, but with a relatively wide “skirt” at the base of the test signal. The FiiO has lots of 20dB spikes, right up to beyond 20kHz. They remain below -110dB, so they should be inaudible. But why such different behaviour?
Still with 24 bits, THD was excellent at 0.00127% and 0.00125%, while IMD+Noise improved a little on the 16-bit results, coming in at 0.037% and 0.038%.
LDAC – a certified high resolution codec
LDAC is Sony’s own codec and was the first to receive certification as being truly High Resolution Wireless. As I said earlier, I had an initial wobble when measuring this because my phone was boosting the bass significantly. Fortunately there was no such problem with the Astell&Kern SE180 digital audio player. But it has two options for LDAC: connection quality optimisation and audio quality optimisation. As we’ll see, they can’t really be lumped in together as one because they are about as different to each other as aptX is to aptX HD. So let’s start with the lower bit-rate one.
LDAC – connection quality optimisation
So, 16 bits and 44.1kHz, frequency response:

So, we’ve got a smooth response to 10kHz, then some wild ±1dB swings – identical for both Bluetooth receivers – before hitting a brick wall at 17.8kHz. You’re not getting 20kHz from this.
Can we get high resolution with connection quality optimisation? Let’s have a look:

Nope. Just the same as for the 44.1kHz signal, except for fewer jags. This was a bit of a surprise because whenever the SE180 was sending audio to the Topping D90SE, the Topping reported that it was decoding a signal sampled at 96kHz. That was regardless of the sample rate of the source that was being transmitted.
The other measurements with 16-bit signals were very strong. For the FiiO and Topping receivers, respectively, noise was at -97.3dBA and -97.8dBA. Dynamic range was 97.3dBA and 97.8dBA. Yes, the figures match. THD was 0.00074% and 0.00042%, while IMD+Noise was 0.010% and 0.0099%. That IMD+Noise figure is a marked improvement over all that has gone before.
And with 24-bit signals, noise was very good at -119.5dBA and -121.6dBA thus:

Again, the FiiO has some 50 hertz junk from the mains, along with some harmonics, but the Topping exhibits none of the spikes it showed with aptX HD.
But dynamic range was very different for the two devices. The Topping’s was an impressive 121.4dBA, but the FiiO only managed 105.4dBA. The graph shows why:

That green trace is first class. The FiiO? Lots of those spikes again.
With 24-bit, 96kHz the THD was excellent at 0.00116% and 0.00083%, and IMD+Noise was pretty good at 0.00959% and 0.00932%.
LDAC – audio quality optimization
Okay, finally, this is the certified high-resolution codec. Remember, with its high bitrate you’ll need to make sure your devices have a nice clear signal path. This is its frequency response on the 16-bit, 44.1kHz test:
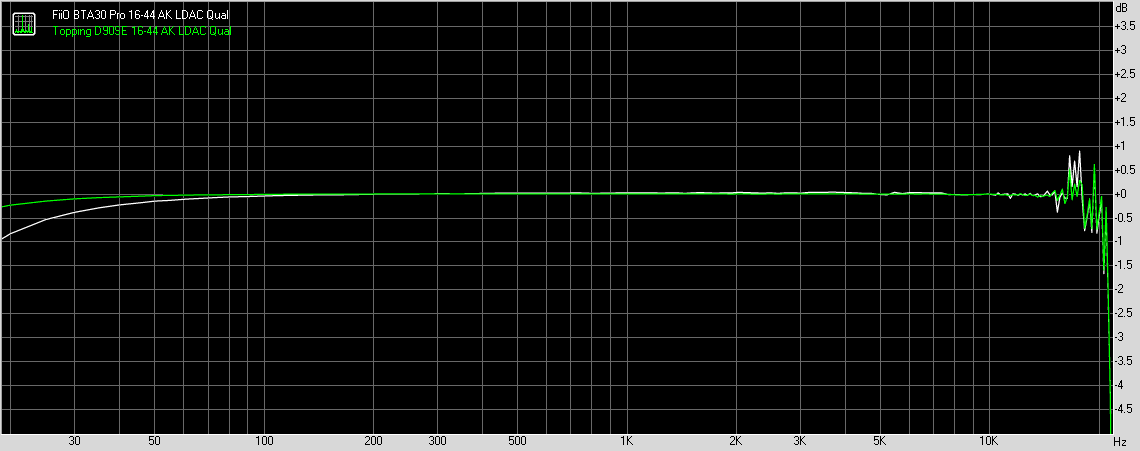
Well, that theme of a jagged top end continues, but now it stretches the response all the way to 20kHz at better than -1dB. Interesting, what’s that slight droop at the bass end? The Topping has been ruler flat in the bass in all my previous tests, but with both forms of LDAC it’s down about 0.25dB at 20 hertz. That has no audible effect, but its consistency does suggest that it’s something to do with the codec, or perhaps the SE180’s implementation of the codec.
And now, finally, let’s see some actual high-resolution Bluetooth. Here’s the frequency response with a 24-bit, 96kHz test signal:

Ooh, interesting. Yes, definitely HD for both but with a markedly different treatment, suggesting some difference in decoding. The FiiO goes almost all the way to the Nyquist frequency (48kHz), while the Topping cuts off hard at 30kHz. They both have those jags in the high frequencies, although in different places to each other.
With 16 bits, the other aspects of performance were excellent. FiiO noise was -97.3dBA while Topping was -97.8dBA. Dynamic range: 97.2dBA and 97.8dBA. THD just 0.00071% and 0.00034%. IMD+Noise was half of that of the previous best: 0.00411% and 0.00362%.
For 24 bits, the noise and dynamic range were reruns from the LDAC version optimised for connection reliability. Noise was -118.8dBA and -121.0dBA, so:

But again the FiiO came up short on dynamic range with 104.7dB compared to the Topping’s 120.7dBA. The graph is interchangeable with the one for the other version of LDAC:

And finishing off, the THD with the FiiO was 0.00113%, and an order of magnitude better with the Topping at 0.00012%. That Topping result is by far and away the best THD result of any of the combinations of equipment and codecs, two orders of magnitude better than SBC, and one order of magnitude better than aptX HD. IMD+Noise was 0.00171% with the FiiO and 0.00051% with the Topping. Again, that Topping result kills all others, a full order of magnitude better than the next best.
Bringing things together
Okay, now that we’ve gone into a fair bit of depth on each of the codecs, let’s try to summarise. In this section in order to keep things manageable, I’ll be using only the measurements made with the Astell&Kern SE180 digital audio player as the Bluetooth source and the Topping D90SE as the Bluetooth receiver. These aren’t always the best-measuring combination – for example, the LDAC audio quality optimised high resolution frequency response is more extended with the FiiO BTA30 Pro. But it means some measure of consistency.
To start, here are the frequency responses with all the codecs on one graph, using a 44.1kHz test signal:

And the same, but for a 96kHz test signal:
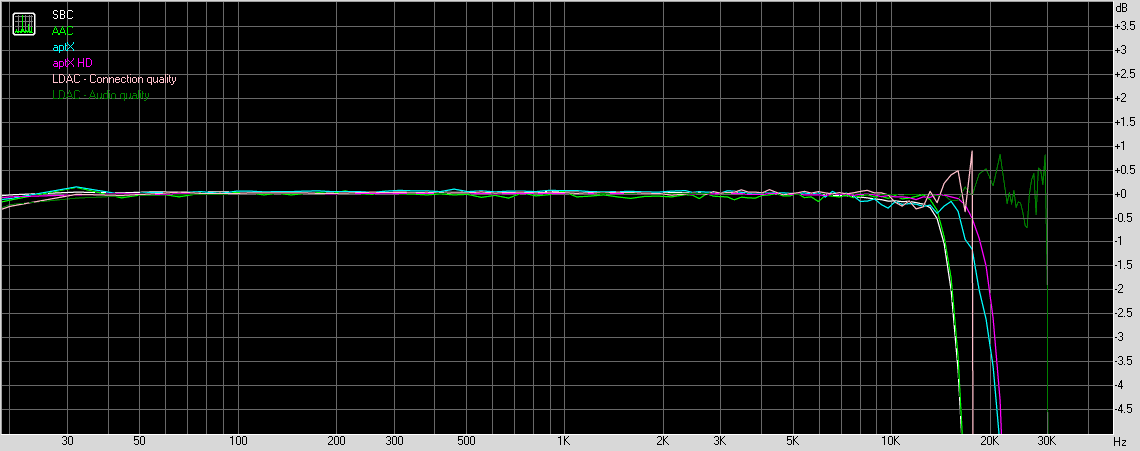
Looking at all of those, you can see that the LDAC Audio Quality optimised (LDAC AQ from here on) clearly gives the greatest high-end extension, and that AAC gives the least (with 44.1kHz) or equal least (with 96kHz).
And, perhaps surprisingly, SBC is really quite reasonable, especially with 44.1kHz sampling.
Now, let’s summarise the other measurements, and then rank the performance of the codecs on them. First, we’ll do 16-bit, 44.1kHz. Here are the results.
| Test | SBC | AAC | aptX | aptX HD | LDAC - Connection quality | LDAC - Audio quality |
| Noise level, dB (A): | -97.0 | -97.6 | -97.2 | -98.4 | -97.8 | -97.8 |
| Dynamic range, dB (A): | 97.5 | 90.6 | 96.5 | 97.8 | 97.8 | 97.8 |
| THD, %: | 0.017 | 0.00090 | 0.00402 | 0.00097 | 0.00042 | 0.00034 |
| IMD + Noise, %: | 0.061 | 0.278 | 0.199 | 0.070 | 0.00987 | 0.00362 |
With all the measured noise levels between -97dBA and -98.4dBA, they are close enough to the same. But it was clear that it was the dynamic range test that showed more critically what was going on. In descending order of dynamic range we had: LDAC CQ/LDAC AQ/aptX HD, then SBC, then aptX and with AAC the worst. And that worst was by a very significant 6dB.
The ranking for THD was, from the best, LDAC AQ, LDAC CQ, AAC, aptX HD, aptX and SBC last. SBC was fifty times “worse” than LDAC. But I’m not sure that this test was actually capturing harmonic distortion at all. Here’s the graph for all the codecs:

What that 0.017% “THD” figure for AAC is capturing looks to be the series of white spikes to the right of the graph. But if you check where those spikes are, you’ll soon see that they aren’t actually harmonics. The first is around 4.5kHz, somewhere between the fourth and fifth harmonic. That is far more objectionable, sound-wise, than real harmonic distortion. Maybe that’s the reason for some of the criticism of the sound of SBC.
Oh, and one other note of interest in that graph, you can see all those weird bumps and whatnot in four of the traces. However the two LDAC ones behave beautifully, with a low noise floor and the test frequency emerging from it, devoid of surrounding junk.
And, finally, there’s that IMD+Noise measure. Here’s the order from best to worst: LDAC AQ, LDAC CQ, SBC, aptX HD, aptX and AAC. The figure for AAC is two orders of magnitude higher than the figure for LDAC AQ.
What about high resolution. Let’s do the same now with our 24-bit, 96kHz tests. First, here’s the results table:
| Test | SBC | AAC | aptX | aptX HD | LDAC - Connection quality | LDAC - Audio quality |
| Noise level, dB (A): | -121.7 | -120.9 | -121.5 | -121.3 | -121.6 | -121.0 |
| Dynamic range, dB (A): | 109.2 | 91.3 | 103.8 | 116.5 | 121.4 | 120.7 |
| THD, %: | 0.017 | 0.00091 | 0.00553 | 0.00125 | 0.00083 | 0.00012 |
| IMD + Noise, %: | 0.025 | 0.229 | 0.190 | 0.038 | 0.00932 | 0.00051 |
Again, it’s not really worth considering the noise level for the different codecs. They all fall within a 0.8dB range. But the variance is very significant for dynamic range. Here we go down from the best: LDAC CQ, LDAC AQ, aptX HD, SBC, aptX to AAC. The LDAC levels are decently impressive (around 121dBA) for 24-bit audio, while the AAC level (91.3dB) would be mildly disappointing for 16-bit audio. I should note, however, that using the iPad as the sending device and the FiiO BTA30 Pro as the receiver, the AAC dynamic range registered at a much better 99.4dBA.
The THD performance in descending order was LDAC AQ (the incredible 0.00012% noted above), then LLAC CQ, AAC, aptX HD, aptX and finally SBC. SBC was two orders of magnitude above the best, but even so came in at less than 0.02%, so was acceptable.
Finally, there’s IMD+Noise. The order: LDAC AQ, some 20 times over LDAC CQ, then SBC, aptX HD, aptX and AAC. Again in AAC’s defence, while it scored a rather high 0.229% with this equipment combination, with the iPad feeding the FiiO BT receiver, it came in at an enormously better 0.04%.
Conclusion
So, what lessons can we draw from all this? Well, I came into this thinking that LDAC may well have been overhyped. And I think I was wrong. LDAC gives excellent performance figures, often an order of magnitude or two better than the other codecs. I was particularly impressed by things like the THD graph above which shows, for LDAC (in both forms) and LDAC alone the kind of result you’d see if the connection was wire, not Bluetooth.
So consider me now an LDAC convert and, indeed, booster.
SBC came off quite well most ways … until I had a look at that same THD graph which showed it producing non-harmonic spikes that could well have verged on low-level audibility. In the real world, in which you’re not actually listening to weird test tones, they are likely not a problem. But who knows? Maybe they are why some audiophiles consider SBC a poor codec.
The penultimate lesson: the audio quality is not just a function of the particular codec. It is also a function of the device implementing the codec. Clearly, all the devices I used worked with the various codecs, but different devices performed differently. I’ve always found this bit of a puzzle. If a codec is well defined, shouldn’t all properly-designed devices produce the same results, apart perhaps from a few subtle analogue variations? The huge difference in things like IMD+Noise for the various codecs, using the same equipment, suggests that this is not the case.
And the ultimate lesson? If you’re going Bluetooth, consider your device options carefully. Listen to both while connected together. There’s a good chance that you won’t even know which codec is in use, especially if you’re using an Android phone as the source. So, spend some time with the devices, listening to your music of preference. You may well be satisfied by SBC. Or you may not know what you’re listening to. In the end, it’s whether you’re finding your music listening fulfilling which counts.


